Introduction to Flowcharts
TL;DR
Flowcharts are visual maps of a process: symbols for steps, decisions, inputs and outputs, connected by arrows that show the flow. This introduction explains what flowcharts are, why they help analyze and communicate workflows, the common ISO 5807 symbols and tips for drawing clear ones.
On this page
Flowcharts are a powerful visual tool that can help you analyze, design, document, and manage workflows or processes. This article will introduce you to the basics of flowcharts, including their definition, usage, common symbols, and an example to illustrate their application. Whether you’re new to flowcharts or looking to refine your understanding, this guide will provide valuable insights.
html Copy code
What is a Flowchart?
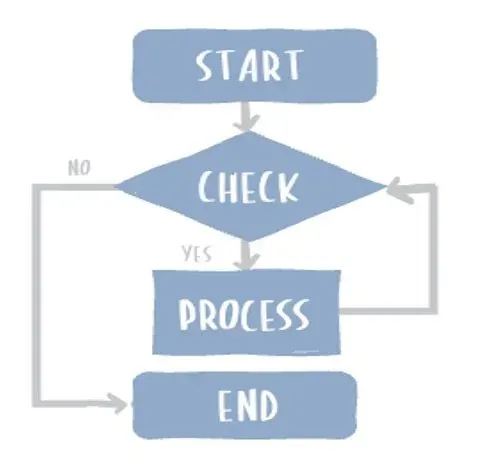
A flowchart is a visual representation of a process or workflow, using various symbols to denote different types of actions, decisions, and steps. The flow of the process is indicated by connecting arrows, guiding the viewer through the sequence of steps. Flowcharts are invaluable tools in a wide range of professions, helping to simplify and communicate complex processes clearly and effectively.
Why Use a Flowchart?
Flowcharts offer a unique way to visualize processes, making them easier to understand and analyze. They can be particularly useful for identifying bottlenecks, redundancies, and inefficiencies in workflows. Additionally, flowcharts are a great way to communicate processes to both technical and non-technical stakeholders, as they provide a clear and concise visual representation that can be understood regardless of the viewer’s background.
Flowchart Symbols
Flowcharts use a variety of standardized symbols to represent different types of actions and decisions. The International Organization for Standardization (ISO) has established a commonly used set of symbols, known as ISO 5807, which is widely adopted in the technology industry. Here are some of the most commonly used symbols:
Commonly Used ISO 5807 Symbols
| Symbol image | Symbol code | Name | Description |
|---|---|---|---|
| Flowline / Arrowhead | Shows the order. Comes from one symbol to another. | ||
| Terminal / Terminator | Shows where a process (or sub-process) starts or ends; text is usually “Start”, “Begin”, or “End”. | ||
| Process / Rectangle | Process, action step, or operation; text is usually a verb, examples include: “Edit Video”, “Choose Plan”, “Set variable to ‘hello’”. | ||
| Data (I/O) | Inputs to (entering data) and Outputs from (displaying results) a process. | ||
| Decision / Conditional | Used to ask a question whose answer determines the route taken from the question. Arrow from bottom is Yes / True, Arrow from side(s) is No / False (Always label the arrows to make it clear). | ||
| Document (s) | Represents a document or report. | ||
| Subroutine / Predefined Process | A process that can be used in the current process but defined elsewhere (should have a separate flowchart for it). | ||
| Annotation (Comment) | Additional info about a step; the line connecting to the step can be solid or dashed. | ||
| On-page Connector | Replaces long or confusing lines; use a letter to reference. | ||
| Off-page Connector | Connects this process to the next step, which is on another page; use page number for reference. | ||
| Data File / Database | Data represented by a cylinder (originally representative of disk drive). |
Additional Tips
Here are some additional tips and insights for effectively using flowcharts:
- Pre-coding Aid: Create a flowchart before coding a task to help structure or validate your pseudo-code. This can clarify your thinking and highlight potential issues early.
- Documentation: Include flowcharts in your project documentation (e.g., README.md files) to visually explain how your project or specific processes work, making it easier for others to understand.
- Presentations: Use flowcharts in presentations to aid audience understanding by providing a clear, visual representation of the process or workflow you’re discussing.
- Troubleshooting: If your function or process is not working as expected, create a flowchart of its current state. Walk through the chart with some example inputs to identify where things might be going wrong.
- Detail Levels: Flowcharts can be as high-level or as detailed as necessary. For instance, you could further break down the flowchart to illustrate memory operations. Additionally, flowcharts aren’t limited to technical tasks—they can also be used to map out everyday decisions, like choosing a movie or deciding where to eat.
A helpful tool for creating flowcharts is draw.io. It offers premade symbols, and your diagrams can be saved to your Google Drive, making it easy to share and collaborate.
Key takeaways 5
- A flowchart shows a process as connected symbols and arrows.
- Flowcharts help analyze, design, document and communicate workflows.
- Ovals mark start and end, rectangles processes, diamonds decisions.
- ISO 5807 standardizes common flowchart symbols.
- Keep one direction of flow and label every decision branch.
Frequently asked questions
What is a flowchart?
A flowchart is a diagram that represents a process or algorithm as a sequence of steps, decisions and inputs or outputs, connected by arrows showing the order of flow.
What do the main flowchart symbols mean?
An oval (terminator) marks start or end, a rectangle is a process step, a diamond is a decision with yes/no branches and a parallelogram is input or output.
What tools can I use to draw flowcharts?
Popular options include draw.io (diagrams.net), Lucidchart, Microsoft Visio, Miro and text-based tools like Mermaid.
Learn it hands-on at AL Academy
Free practical programs in software, automation and IT, with labs and certificates.
Related articles
Business Process Mapping & Optimization
Before you buy software to fix a slow process, draw it. A simple map of how work really flows will show you more than any vendor demo - and stop you from automating a mess.

What is Pseudocode?
Before diving into the complexities of programming languages, every programmer should start with a clear plan.
Getting Started with Digitalization
You don't need a moonshot to start digitalizing. The fastest, safest way to begin is to pick one annoying process and make it flow better with tools you already have.
Comments
No comments yet. Start the conversation.