OEE & Real-Time Production Monitoring
OEE turns the messy reality of a production line into one honest number - and real-time monitoring turns that number into daily improvement. Here is how the metric works and how to make it actually move.
TL;DR
Uptime hides slow running, micro-stops and defects. Overall Equipment Effectiveness multiplies availability, performance and quality into one honest number, rooted in Total Productive Maintenance and the six big losses. Real-time monitoring turns OEE from a monthly report into a daily improvement engine.
On this page
Walk onto almost any factory floor and ask how the line is doing, and you will get an answer in the comfortable currency of uptime. “The machine was up 95 percent of the shift.” It sounds healthy. It usually is not. Uptime is a single, generous lens that quietly ignores a machine running slow, stopping for thirty seconds every few minutes, or churning out parts that fail inspection. Overall Equipment Effectiveness - OEE - exists precisely because that comfortable number hides far too much.
OEE came out of the Total Productive Maintenance movement in Japan, where Seiichi Nakajima formalized the idea that equipment loses capacity in three distinct ways, and that you cannot manage what you refuse to separate. The metric answers one blunt question: of all the time you planned to make good parts, how much did you actually spend making good parts at full speed? Everything else is loss.
One number, three honest factors
OEE is the product of three ratios. Availability asks whether the equipment was running when it was supposed to. Performance asks whether it ran as fast as it should have. Quality asks whether the parts were good the first time. Multiply them together and you get OEE.
OEE = Availability x Performance x Quality
The multiplication is the whole point. Because the three factors multiply rather than average, you cannot hide a weakness behind a strength. A line that scores a respectable 85 percent on each factor is not running at 85 percent. It is running at 0.85 x 0.85 x 0.85, which is about 61 percent. That gap - the difference between how good each part feels and how poor the whole is - is the capacity quietly leaking out of the plant every shift.
Each factor has a precise definition. Availability is run time divided by planned production time, where planned production time is the day minus the stops you intended (breaks, scheduled maintenance, no demand). Performance is the ideal cycle time multiplied by the total count, divided by run time - in plain terms, how close you came to the fastest sustainable speed. Quality is the first-pass good count divided by the total count; reworked parts do not count as good, because rework consumed capacity you will never get back.
Consider a real shift. Eight hours is 480 minutes. Take out 40 minutes of planned stops and you have 440 minutes of planned production time. Forty-seven minutes of breakdowns and changeovers leave 393 minutes of run time. The line made 19,271 units at an ideal cycle of one second each, of which 423 were rejects. Availability is 393 / 440, or 89.3 percent. Performance is (one second x 19,271) / 393 minutes, or 81.7 percent. Quality is 18,848 good / 19,271 total, or 97.8 percent. Multiply: OEE is 71.4 percent. In seconds, the three factors have told you not just that the line lost capacity, but where - performance is the weak link, so the team should hunt minor stops and speed losses, not chase breakdowns.
The six losses underneath
Those three factors map onto six canonical loss categories. Availability is eroded by breakdowns and by setup and adjustment time. Performance is eroded by idling and minor stops and by reduced speed. Quality is eroded by process defects and by startup yield losses. Classifying every logged loss into one of these six buckets is what converts a low score into a to-do list. A duration threshold cleanly separates a breakdown from a minor stop; a little discipline separates a process defect from a warm-up reject. Tally the buckets, sort them largest first, and the Pareto principle does the rest: a handful of loss types almost always own the majority of the lost time. Attack the biggest one, run a few rounds of “why” until you reach a cause you can actually fix, and you have spent your effort where the return is greatest.
Monitoring is the engine, not the report
None of this matters if OEE is a number someone calculates at month-end and files. The plants that improve build a loop that runs every single day. Real-time monitoring - whether a hard-won spreadsheet on a pilot line or a fully instrumented setup pulling counts and stop signals straight from the controllers - feeds that loop with timely, trustworthy data. Manual capture is cheap and builds operator ownership, but it is retrospective and quietly loses the short stops. Automated, IIoT-style capture catches even sub-second micro-stops and scales across lines, though it still usually needs a human to tap in the reason a stop happened. Most plants do both: pilot by hand to learn the reason codes, then automate the counting.
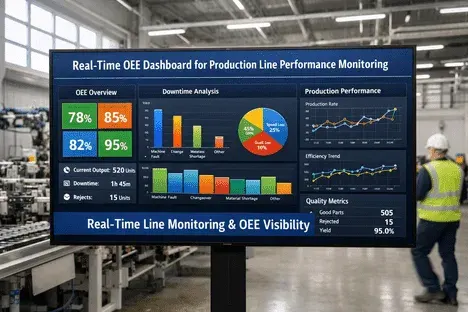
On top of the data sit three layers of action. Andon raises an abnormal condition the instant it occurs, with a named owner and an escalation path, so losses are killed while they are still small. Dashboards make the live state and the loss Pareto visible to everyone on the floor, turning private suspicion into shared, undeniable reality. And a short daily stand-up at the board closes the loop: review yesterday’s OEE, read the top loss, confirm its root cause, assign one countermeasure with an owner and a date, and check whether last week’s fix actually moved the needle.
That cadence is the real lesson. OEE is just the gauge. The engine is the daily habit of sensing loss, signaling it, seeing it together, acting on it, and locking in the gain so the baseline rises. Run that loop and OEE stops being a verdict on the past and becomes the steady mechanism by which a plant frees the capacity it already owns - no new machines required.
Key takeaways 5
- Uptime alone hides slow cycles, short stops and scrap.
- OEE = Availability × Performance × Quality.
- The six big losses explain where capacity disappears.
- Real-time data shows losses while they can still be fixed.
- Use OEE to drive improvement, not to blame operators.
Watch & learn

Frequently asked questions
How do you calculate OEE?
OEE = Availability × Performance × Quality. Availability is run time divided by planned production time, performance is actual output versus ideal speed and quality is good parts divided by total parts.
What is a good OEE score?
About 85% is often called world-class for discrete manufacturing, while many plants operate between 40% and 60%. Trends and losses matter more than comparing a single number.
What are the six big losses?
Equipment failures, setup and adjustments, idling and minor stops, reduced speed, process defects and reduced yield at startup.
Go deeper with the free masterclass
Workshop, PDF handbook and curated resources for “OEE & Real-Time Production Monitoring”.
Related articles
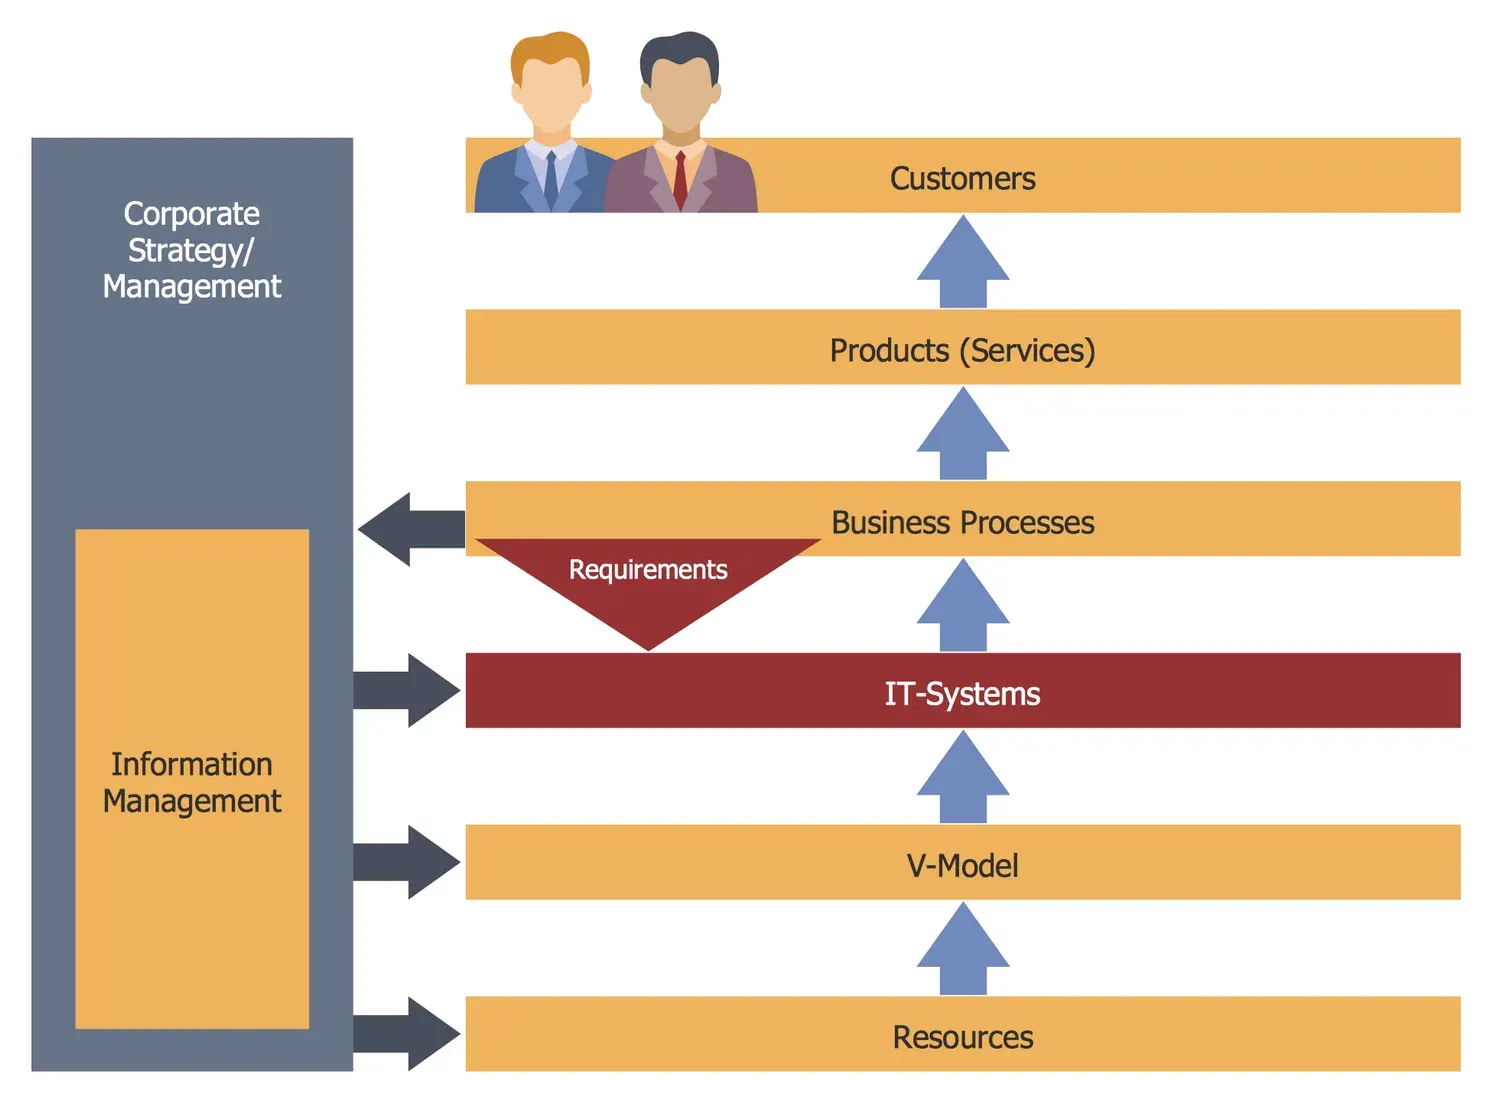
Business Process Mapping & Optimization
Before you buy software to fix a slow process, draw it. A simple map of how work really flows will show you more than any vendor demo - and stop you from automating a mess.
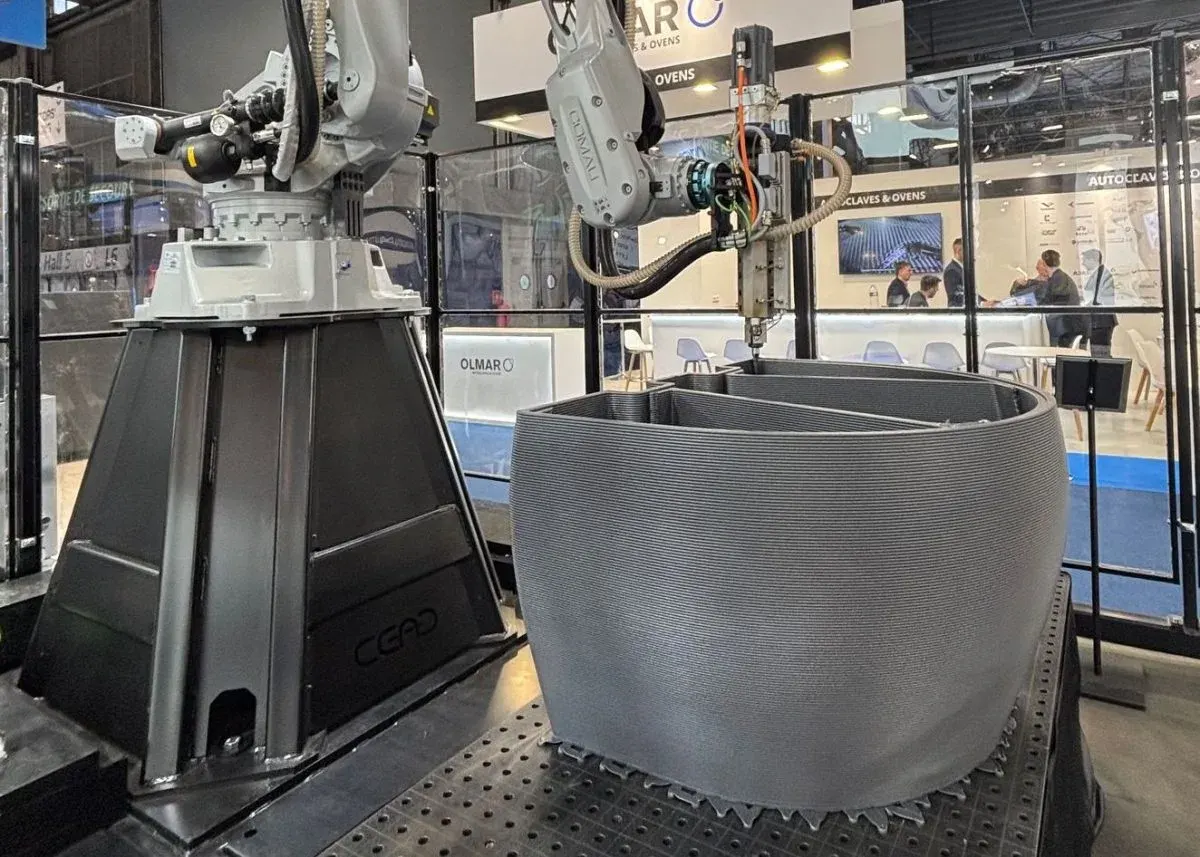
Additive Manufacturing (3D Printing) for Production
3D printing stopped being a prototyping toy years ago. Here is how to tell when it is the right way to make a real production part - and when it absolutely is not.

Kanban for Knowledge Work
Knowledge work hides in tickets, inboxes, and people's heads. Kanban drags it into the light, caps how much you juggle at once, and lets the math of flow do the rest.
Comments
No comments yet. Start the conversation.