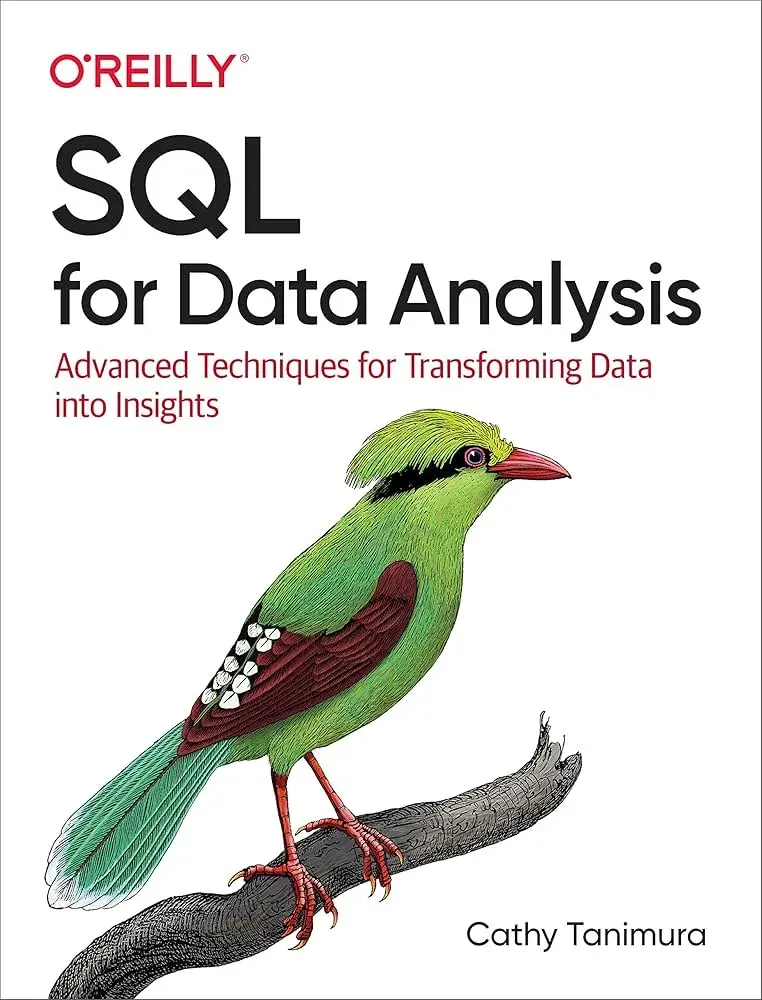
SQL for Data Analysis
Spreadsheets hit a wall when data gets big or lives in a database. SQL is the skill that takes you past it, and the core of it fits in an afternoon.
TL;DR
Spreadsheets slow down and struggle to combine datasets once data grows or lives in a database. SQL takes you past that wall, and its core fits in an afternoon: SELECT and WHERE to filter, GROUP BY to summarize, JOIN to combine tables and subqueries or CTEs to build bigger answers.
On this page
Most people who analyze data for a living started in spreadsheets, and for good reason. A spreadsheet is immediate and visual; you can see every number. But spreadsheets quietly run out of room. They slow to a crawl past a few hundred thousand rows, they make combining two separate datasets painful, and they live on your laptop rather than in the system where the data actually originates. Sooner or later, the real data you need is in a database, and the language that database speaks is SQL.
The good news for beginners is that SQL was designed to be readable. A well-written query reads almost like a sentence: select these columns, from this table, where this condition holds, ordered by that column. You do not need to be a programmer to learn it. You need to understand a few ideas and then practice translating questions into queries.
Why analysts keep coming back to SQL
SQL has outlasted nearly every tool built on top of it. Business intelligence platforms, dashboards, and notebook environments rise and fade, but underneath almost all of them sits a relational database answering questions in SQL. Learning it is therefore one of the highest-leverage investments an analyst can make, because the skill transfers everywhere. The same SELECT statement works whether the data sits in SQLite on your laptop, PostgreSQL on a server, or a cloud warehouse handling billions of rows.
It is also fast. Databases are engineered to filter, sort, and aggregate enormous tables efficiently. Asking a database for “total revenue by country last quarter” returns an answer in moments, where a spreadsheet might choke or simply lack the rows.
The mental model
Everything in a relational database lives in tables of rows and columns. A row is one thing, such as a single order. A column is one attribute of that thing, such as the amount or the date. Crucially, related information is split across several tables and linked by keys. Customer details sit in a customers table; their orders sit in an orders table that references each customer by an identifier. This separation, called normalization, keeps the data consistent, and a big part of analysis is reassembling those tables to answer a question.
Once you hold that picture in mind, the four core operations of analysis fall into place. You filter to the rows that matter. You group rows into categories and summarize them. You join tables back together. And you order and trim the result so a human can read it.
Filtering and summarizing
The simplest useful query selects some columns and filters with a WHERE clause: show me the orders above one hundred placed since March. From there, the leap that makes SQL genuinely analytical is aggregation. Instead of returning individual rows, you collapse them into summaries with functions like COUNT, SUM, and AVG. Pair those with GROUP BY and you get one summary row per category: orders per customer, revenue per country, average basket size per month.
A subtle but important distinction trips up almost every beginner. The WHERE clause filters individual rows before they are grouped. To filter on a summarized value, such as “only customers who spent more than five hundred,” you need HAVING, which filters the groups after the totals are computed. Internalizing that one rule removes a large share of early frustration.
Joining tables
The real power of a relational database shows up when you combine tables. A JOIN matches rows from two tables on a shared key, letting you put the customer’s name next to their order, or sum each country’s revenue by linking orders back to customers. The two joins worth learning first are the inner join, which keeps only rows that match in both tables, and the left join, which keeps every row from your main table and fills blanks where the other table has no match. That left join is how you answer the quietly important questions: which customers have never ordered, which products never sold.
Building bigger answers
Real questions rarely fit in one clean step. SQL gives you common table expressions, written with the keyword WITH, to break an analysis into named stages that read top to bottom like a recipe: first compute each customer’s total spend, then label each customer by tier, then count how many fall in each tier. Each step is simple; stacked together they answer something genuinely useful. This stepwise style is also far easier to debug than a single deeply nested query, which matters because debugging is where analysts actually spend their time.
Getting started for real
You do not need a server or special permissions to begin. SQLite is free, stores an entire database in a single file, and runs on every major platform. You can create a couple of tables, insert a handful of rows, and start asking questions within minutes. Type a query, run it, see what comes back, adjust, and run it again. That tight loop is the fastest way to learn; reading about SQL teaches the vocabulary, but writing queries teaches the language.
Treat your first questions as practice translations. Take something a colleague might actually ask, “who are our top five customers this year,” and walk it into its parts: which table, which rows, grouped how, sorted by what, limited to how many. Do that a dozen times and the translation becomes automatic. At that point SQL stops feeling like a barrier between you and the data, and starts feeling like the most direct route to an answer you can stand behind.
Key takeaways 5
- SQL lets analysts work with data where it lives.
- SELECT, FROM and WHERE choose and filter data.
- GROUP BY with aggregates summarizes like a pivot table.
- JOINs combine related tables.
- CTEs break complex analysis into readable steps.
Watch & learn

Frequently asked questions
Why should data analysts learn SQL?
Because most business data is stored in databases. SQL lets you query, filter, join and summarize large datasets directly and reproducibly, beyond spreadsheet limits.
What is the difference between WHERE and HAVING?
WHERE filters rows before grouping; HAVING filters groups after aggregation, for example keeping only customers whose total sales exceed a value.
What is a CTE in SQL?
A Common Table Expression, written with WITH, defines a named temporary result that can be referenced in the main query, making complex queries easier to read.
Go deeper with the free masterclass
Workshop, PDF handbook and curated resources for “SQL for Data Analysis”.
Related articles

Machine Learning for Analysts
You do not need a PhD to build a useful model. You need to frame the problem, respect the test set, and know when to stop.
Intro to Statistics for Analysts
You already work with data every day. Here are the five statistical ideas that will stop the numbers from quietly misleading you.
Data Analysis: From Spreadsheets to Python
You already think in rows, columns, and pivot tables. Here is why those same instincts make pandas the natural next step, and when it is worth the switch.
Comments
No comments yet. Start the conversation.