KPIs & Dashboards for Operations
Most operations track dozens of numbers and steer by none of them. The fix is not more data or a prettier dashboard - it is the unglamorous discipline of choosing the few metrics that actually change what you do.
TL;DR
Operations floors are full of numbers that drive no decisions. A KPI is not just any metric: it is one of the few numbers tied to a goal and an action. Hitting the wrong number perfectly is dangerous, rigorous definitions win trust, and dashboards should be tools wired into decisions, not decoration.
On this page
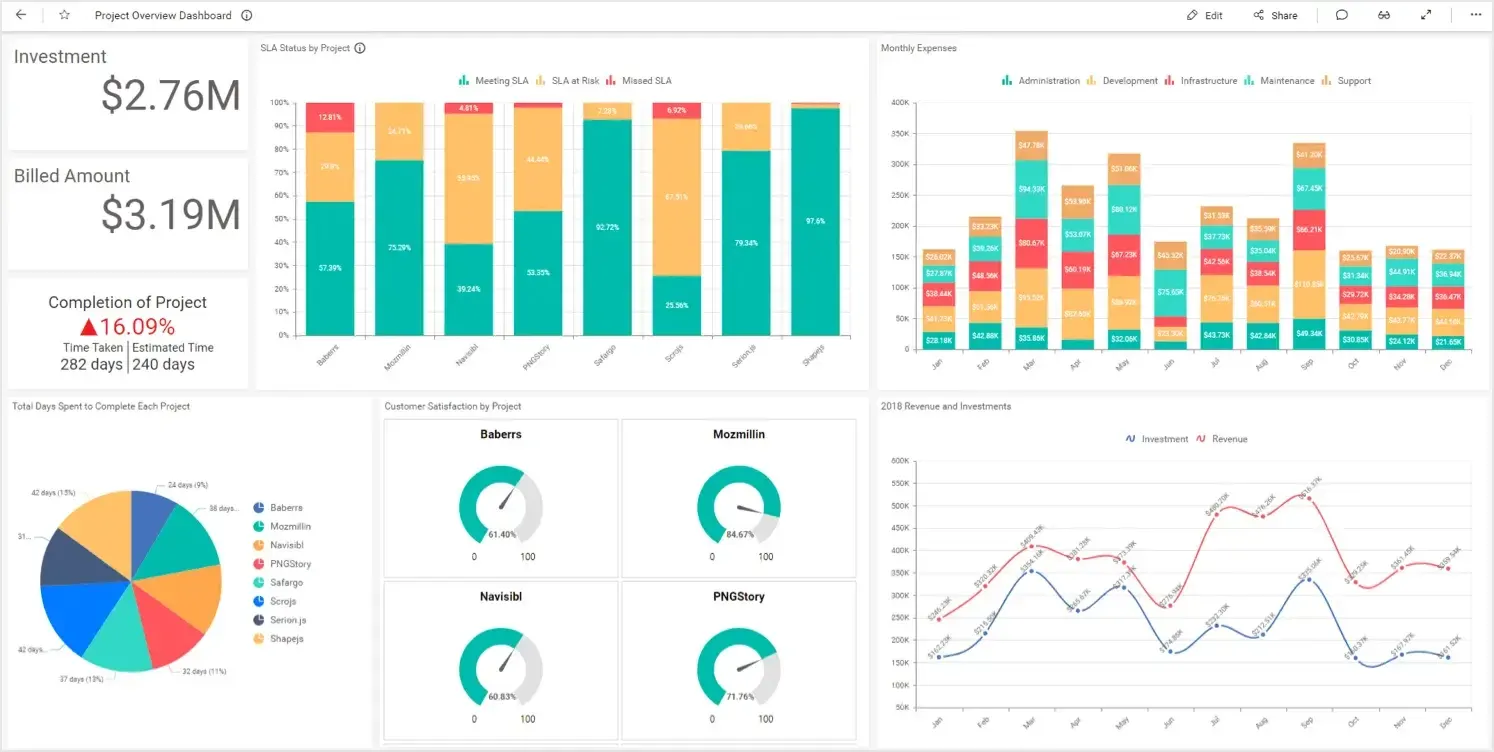
Walk onto almost any operations floor and you will find a screen glowing with numbers. Throughput, uptime, ticket counts, units shipped, a dozen percentages in a dozen colours. Ask the supervisor what those numbers told them to do this morning, and you often get a pause. The dashboard is full. The decisions it produced are empty.
This is the central paradox of operational measurement: more numbers usually mean less clarity. The skill that matters is not collecting metrics - modern systems spit those out by the thousand - but choosing the handful that are genuinely key, defining them so rigorously that everyone trusts them, and wiring them into a rhythm that turns red squares into action. That is a management discipline, and it has almost nothing to do with which charting tool you use.
A KPI is not a metric
Start with a distinction that quietly sinks most measurement efforts. A metric is anything you can count. A Key Performance Indicator is the rare metric that tells you whether you are achieving an objective you actually care about. The word “key” is a promise that you have been selective, and selectivity is where the value lives.
The simplest test for whether a number deserves space on your dashboard is this: if it moved, would anyone do anything differently? Cumulative totals fail instantly - “orders processed since launch” only ever climbs and informs no decision. So do most of the metrics that feel reassuring in a report. They are vanity numbers, and they crowd out the few indicators that would tell you something uncomfortable and useful.
The other distinction worth internalizing is leading versus lagging. Revenue, defect escapes, quarterly on-time delivery - these are lagging indicators. They are accurate and they are late, arriving after the result is already fixed. Backlog age, first-pass yield, near-miss reports - these are leading indicators. They are noisier and they are early, which means they are the only ones you can actually steer by. A mature operation pairs them: it watches a lagging number to know if it is winning, and the one or two leading numbers it believes drive that outcome, so it can act before the lagging number embarrasses anyone.
The wrong number, hit perfectly
Here is the failure mode that should keep operations managers awake. It is not measuring too little. It is choosing the wrong KPI and then succeeding at it.
Goodhart’s law states it cleanly: when a measure becomes a target, it ceases to be a good measure. Reward a call centre on call volume and agents will end calls fast and resolve nothing. Reward a warehouse on units shipped and the quality checks quietly evaporate. Push on-time delivery with no eye on cost and you will air-freight your margin into the ground hitting your number. Every KPI you set is also an incentive you create, and people are far more inventive at hitting numbers than managers are at writing them.
The defence is not to abandon measurement - it is to design for the gaming from the start. Pair every “go faster” metric with a “don’t break things” metric. Throughput with quality. Speed with cost. Volume with rework. A team can game one number, but it cannot game two opposing ones at once. This is the real reason frameworks like the balanced scorecard endure: not because four perspectives are magic, but because carrying measures across financial, customer, process, and improvement at the same time stops you from optimizing one dimension into a ditch.
Definition is where trust is won or lost
Even the right KPI is worthless if two people compute it two ways. “On-time delivery” sounds unambiguous until you discover one report counts the promised date and another the customer’s requested date, one counts partial shipments as on-time and the other does not. Same words, different fact, and now the number is an argument instead of a guide.
This is why the most important artefact in operational measurement is the least exciting one: the KPI definition sheet. One page per KPI, fixing the formula, the data source, the frequency, the single owner, the target, the amber and red thresholds, the deliberate exclusions, and - if you are serious - the way the metric could be gamed and how you will catch it. A KPI without this sheet is a rumour. A KPI with it is something a whole team can stand in front of and trust.
Dashboards are tools, not decoration
A dashboard exists to prompt a decision at a specific moment for a specific audience. The frontline needs this shift; the manager needs this week; leadership needs this quarter. One mega-dashboard built to serve all three serves none. On the floor, clarity beats completeness: one screen, no scrolling, traffic lights against your thresholds, actual paired with target, a small trend so you can see direction, and a running band of issues and countermeasures so the board shows the operation acting rather than merely watching. If a visitor cannot tell within ten seconds whether today is a good day or a bad one, the dashboard has failed, however much data it holds.
And none of it matters without cadence. A dashboard with no meeting attached is wallpaper. A daily ten-minute stand-up at the board, a weekly trend review, a monthly look at whether the KPI set itself is still right - that rhythm is what converts measurement into management. Every red leaves the room with a countermeasure, one owner, and a due date, and the next meeting checks whether it happened.
The discipline, in one line
Strip away the tooling and the frameworks and what remains is small. Choose few numbers, tie each to a real objective, define them so they cannot lie, balance them so they cannot be gamed, and review them on a rhythm that ends in action. The goal was never to measure more. It was to measure the handful of things that change what you do tomorrow morning - and then to actually do them.
Key takeaways 5
- More numbers usually mean less clarity.
- A KPI is a metric tied to a goal and to a decision.
- Optimizing the wrong KPI can damage the business.
- Precise, shared definitions are what make KPIs trusted.
- Dashboards should trigger action, not decorate walls.
Watch & learn

Frequently asked questions
What is the difference between a KPI and a metric?
A metric is any measurement. A KPI (Key Performance Indicator) is one of a small number of metrics directly linked to strategic or operational goals and used to drive decisions.
How many KPIs should a team track?
Usually only a handful, often three to seven per team, so attention stays on what matters. Supporting metrics can sit behind them for diagnosis.
What makes a good operations dashboard?
It shows a few clearly defined KPIs against targets, highlights exceptions, is updated at the pace decisions are made and makes it obvious what action to take.
Go deeper with the free masterclass
Workshop, PDF handbook and curated resources for “KPIs & Dashboards for Operations”.
Related articles
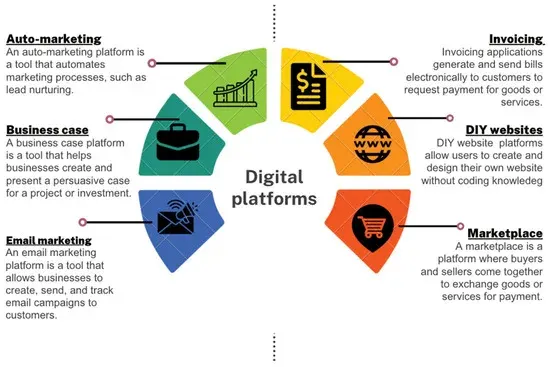
Digitalizing SME Operations End-to-End
Small businesses do not fail to go digital because the software is too hard. They fail because they buy tools before they understand their own work. Here is the order that actually works.
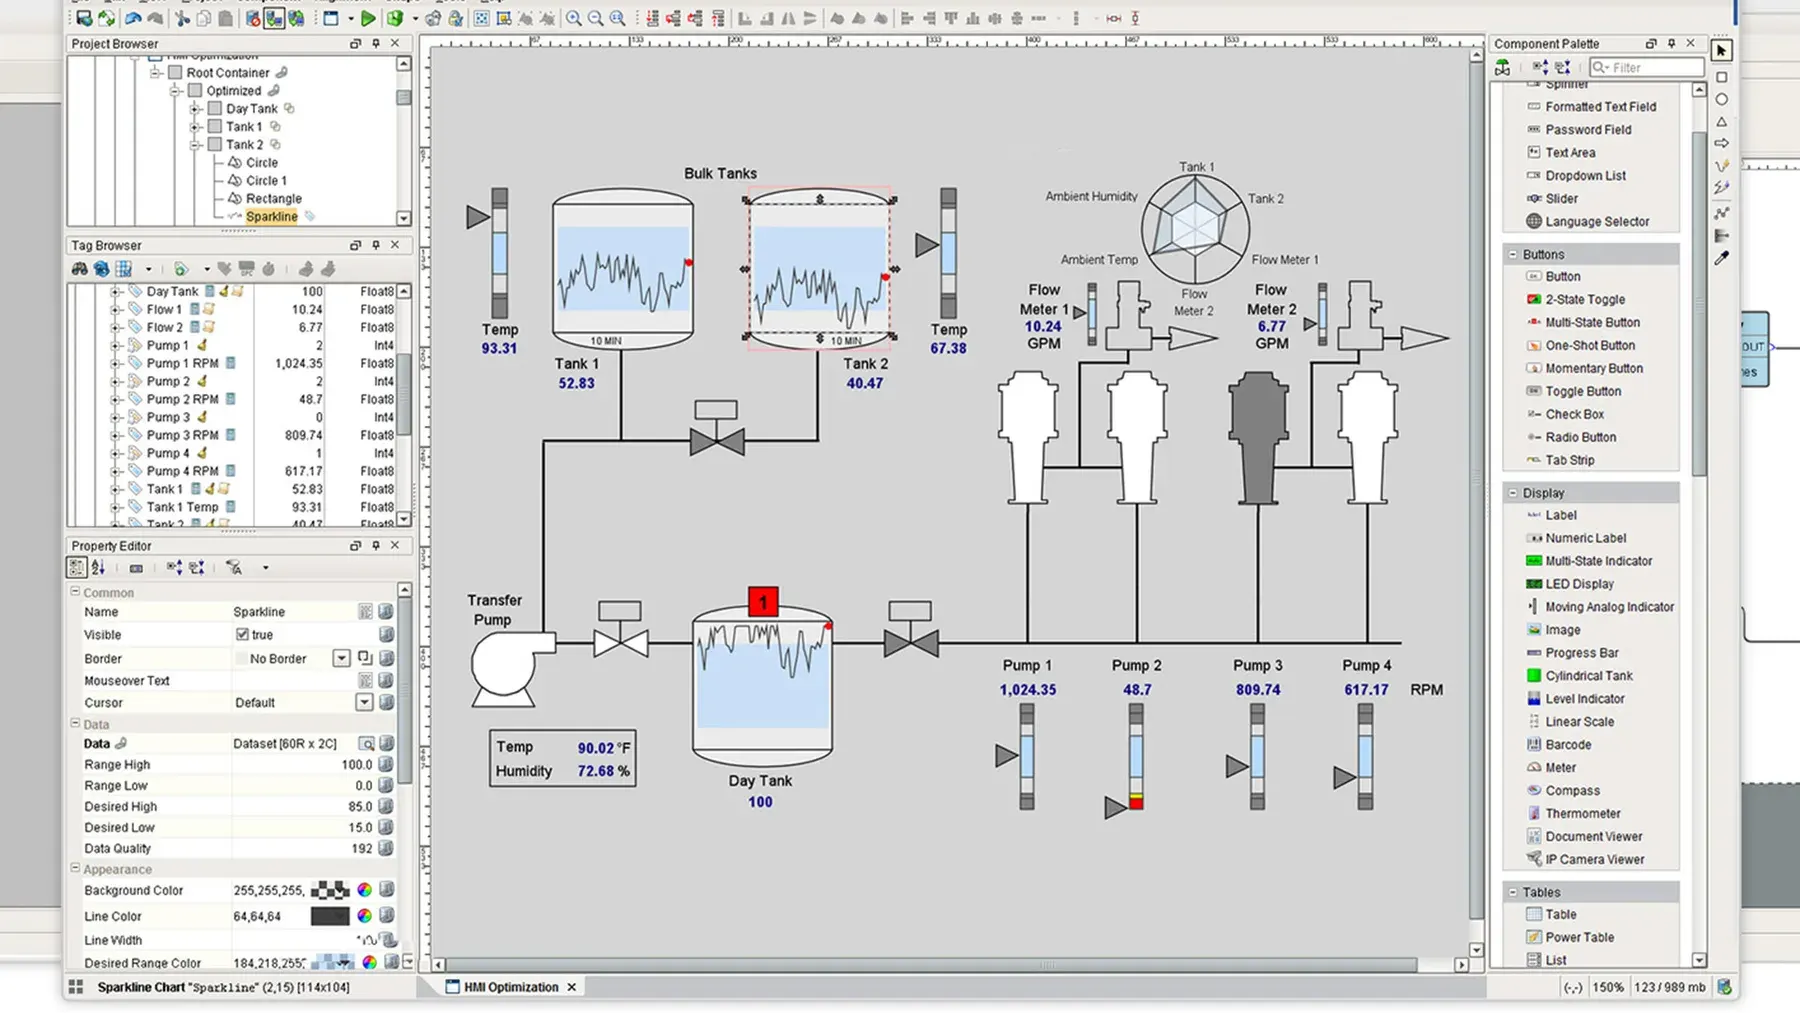
HMI Design Best Practices
The most useful control-room screen is often the most boring-looking one. Here is why high-performance HMI design trades color and gloss for calm, and how that calm keeps operators in command.
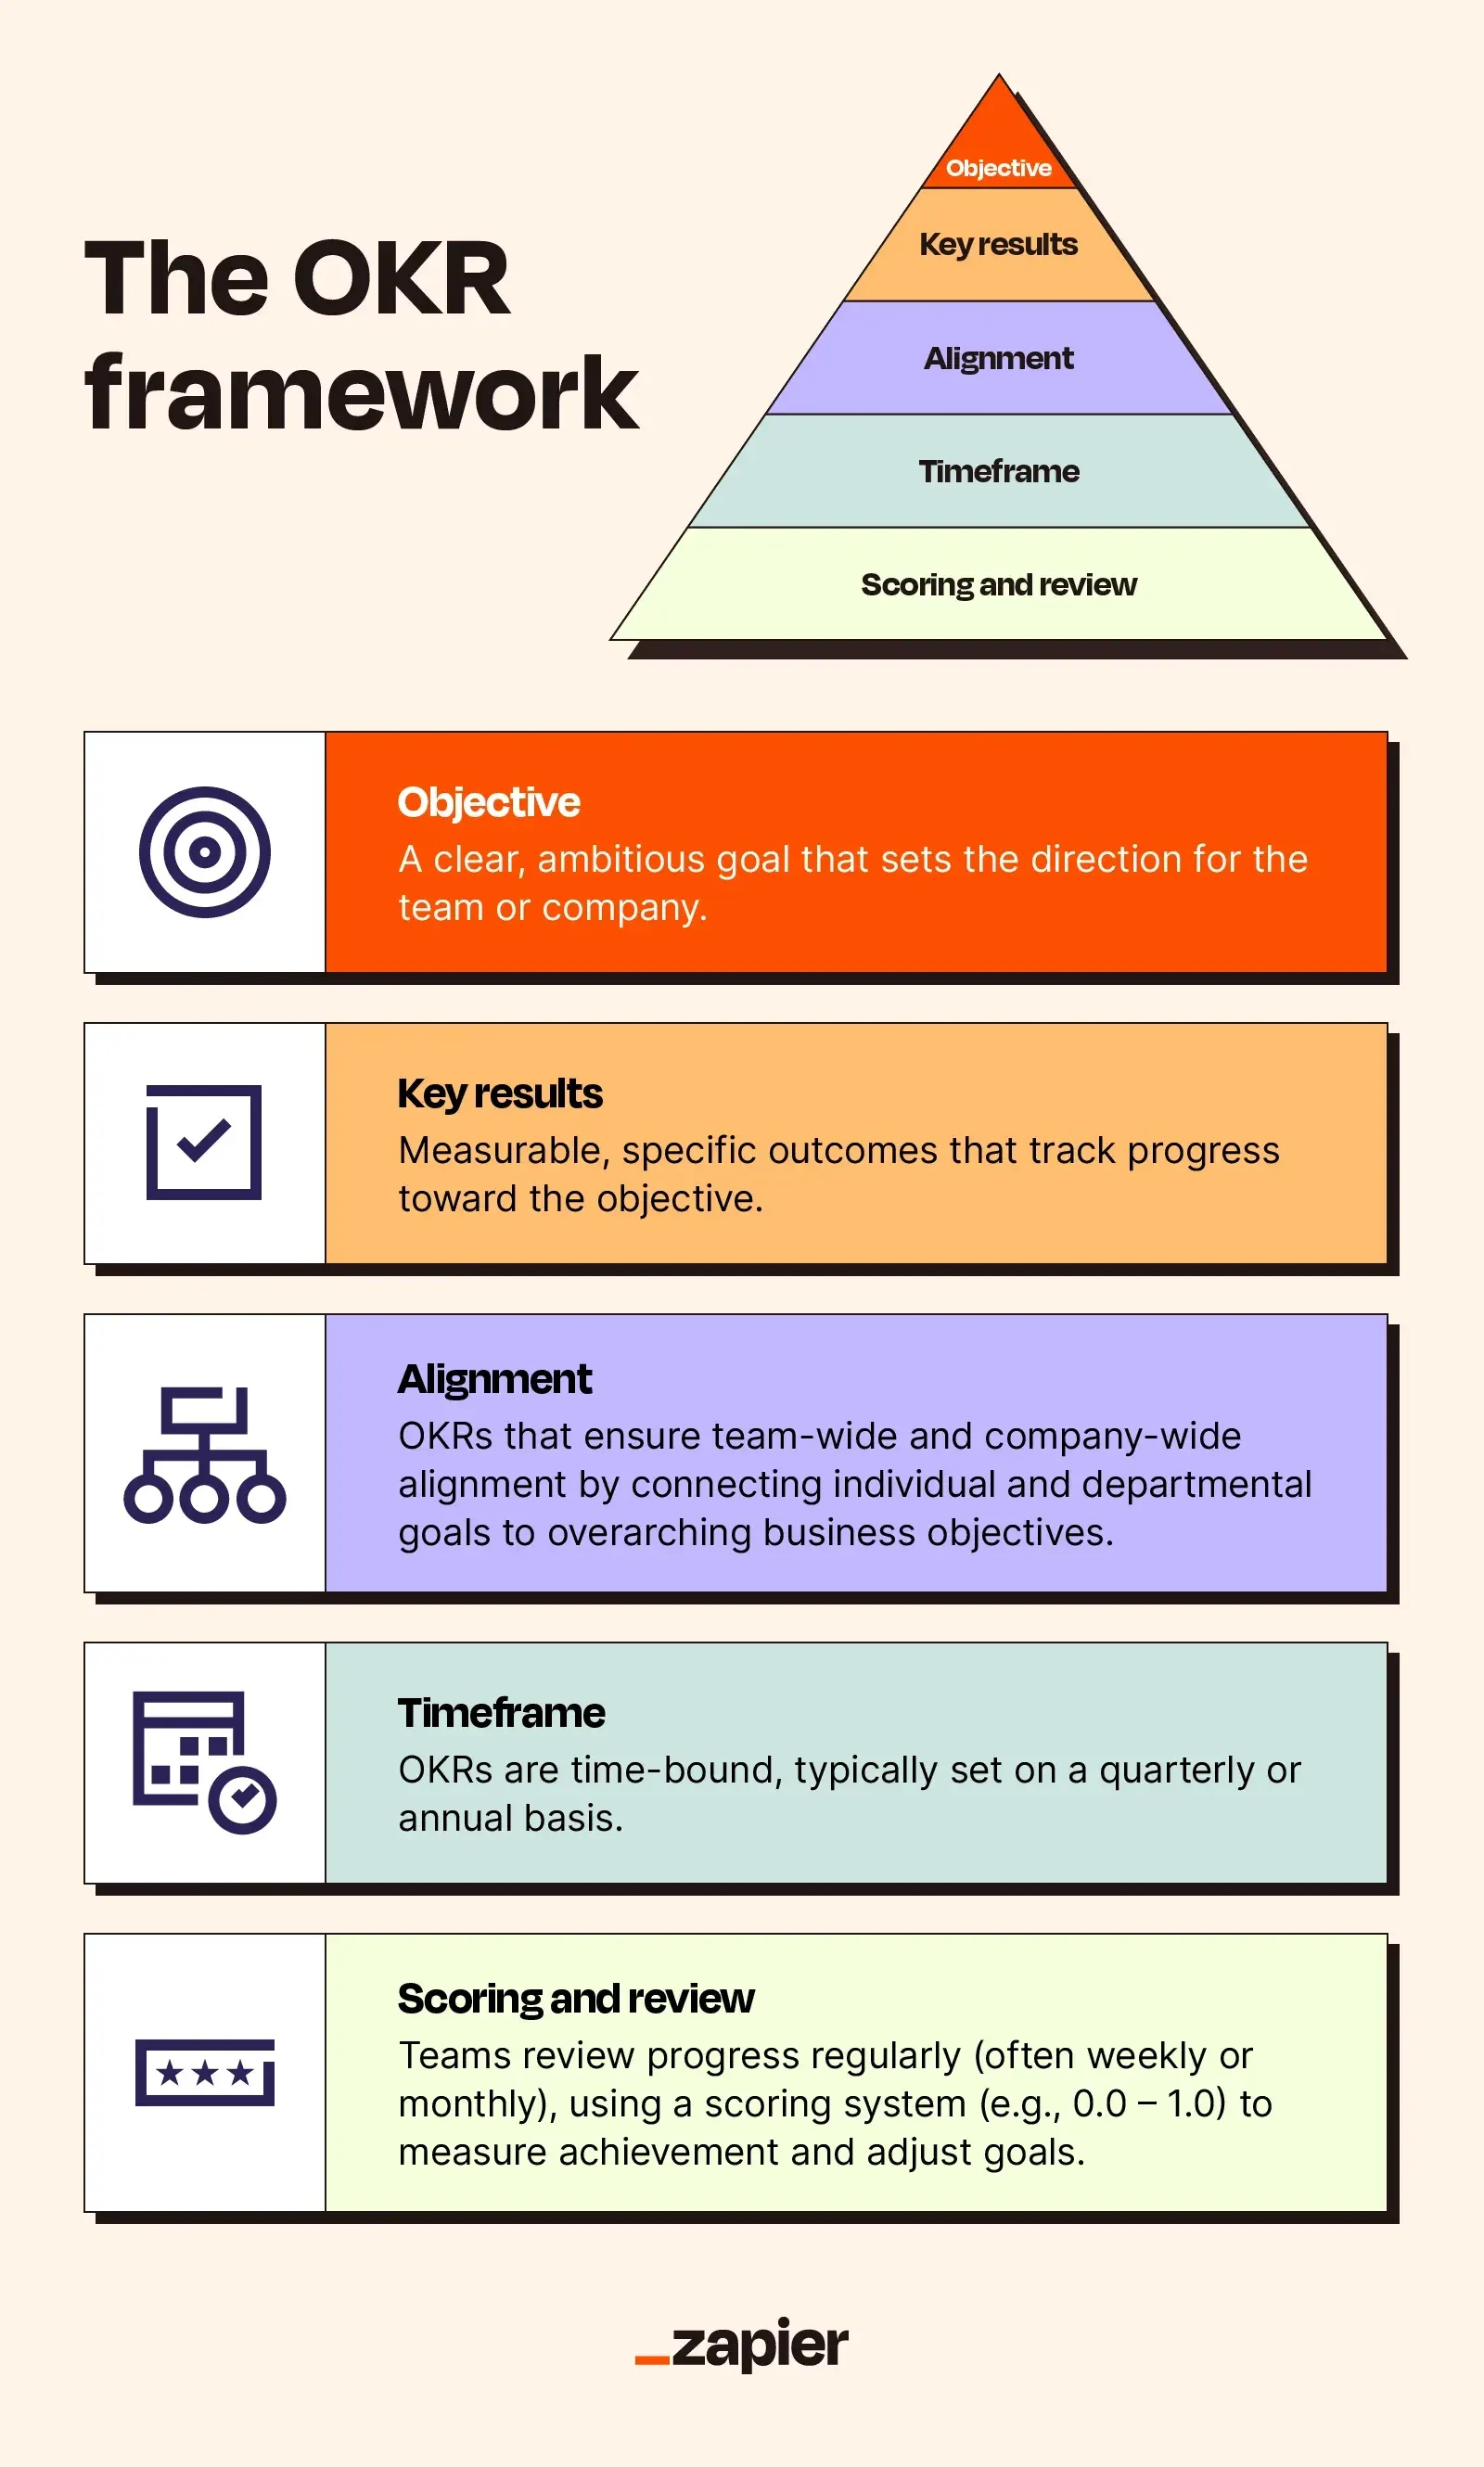
OKRs & Goal-Setting for Teams
Most teams don't lack ambition - they lack a finish line. Here's what changed when mine started writing goals we could actually score.
Comments
No comments yet. Start the conversation.