Data Cleaning & Wrangling with pandas
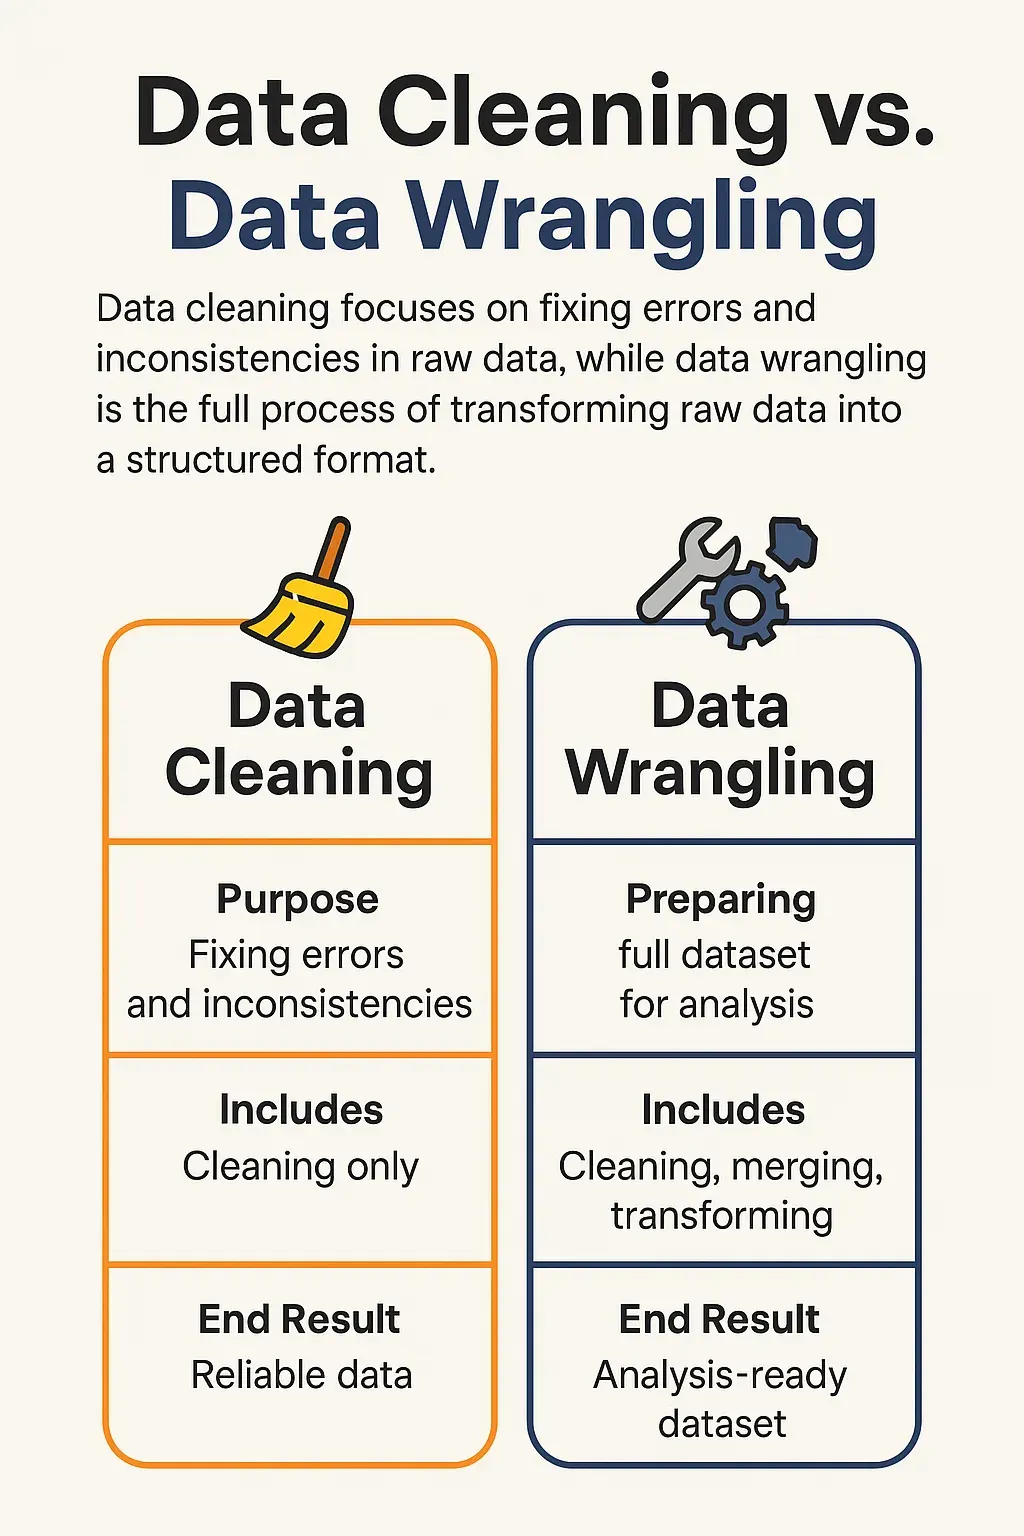
Analysts love to talk about models and dashboards, but the real job is mostly cleaning. Here is why that unglamorous work deserves more respect - and a sharper method.
TL;DR
Analysts spend much of their time cleaning data, and that unglamorous work decides whether results can be trusted. Aim for tidy data (one variable per column, one observation per row), tackle the common messes like missing values, wrong types, duplicates and inconsistent labels, and turn one-off fixes into a repeatable pandas pipeline.
On this page
There is a number that gets quoted at every data conference, usually with a knowing sigh: analysts spend most of their time cleaning data and only a sliver actually analyzing it. The exact figure shifts depending on who is talking, so I will not pretend to a precise statistic. But anyone who has done the work knows the shape of it is true. The headline skills - modeling, visualization, machine learning - sit on top of a much larger, much quieter foundation of getting messy data into a state where those skills can even be applied.
We treat this foundation as a chore. It is the thing you rush through to get to the interesting part. I want to argue the opposite: cleaning is the interesting part, or at least the decisive one, and treating it as an afterthought is how good analyses go quietly wrong.
Garbage in, confident garbage out
The danger of dirty data is not that it crashes your code. Often it does not crash anything at all. A column of prices stored as text will happily refuse to sum, and you will notice. But a column where “USA” and “U.S.A.” are treated as two different countries will produce a perfectly clean-looking bar chart that is simply wrong. A few duplicate rows will inflate your revenue total by a believable amount. A placeholder like “N/A” left as text instead of a true null will skew an average without ever raising an error.
This is the real hazard: dirty data does not announce itself. It produces answers that look right, get put in a slide, and drive a decision. The cost is not a stack trace; it is a quietly wrong conclusion that nobody catches until much later, if ever. Clean data is what stands between a confident answer and a correct one.
Tidy is a target, not a vibe
The good news is that “clean” is not a vague aspiration. There is a concrete target, and it has a name: tidy data, a framing popularized by Hadley Wickham. A dataset is tidy when each variable is its own column, each observation is its own row, and each kind of thing being measured lives in its own table. That is it.
What makes this so useful is that pandas - and really the entire grammar of data analysis - is built to reward that shape. When your data is tidy, grouping, filtering, joining, and plotting feel effortless because the tools were designed for exactly that layout. When it is untidy, you spend your day fighting the library, reshaping in your head, and writing brittle workarounds. Most of the frustration people blame on pandas is really the friction of feeding it untidy data.
So a huge fraction of cleaning is just movement toward tidy. The classic culprit is a table where the column headers are actually values - twelve columns named for the months, say, when “month” should be a single variable. The fix is a single melt operation, and suddenly everything downstream gets easier. Recognizing untidiness is half the skill.
The four messes
Underneath the tidy ideal, the actual day-to-day work tends to fall into four recurring messes, and it helps to name them so you can attack them systematically.
The first is wrong types. Numbers stored as text, dates stored as strings, yes-and-no stored instead of true booleans. Until the types are right, nothing else works, so this comes first.
The second is missing values, including the ones in disguise - the empty strings, the dashes, the sentinel “minus nine ninety-nine” that some system wrote instead of a real null. The skill here is not memorizing a fill command; it is deciding, per column, whether to drop, fill, or flag, based on how much is missing and why.
The third is inconsistency: the spelling variants, stray whitespace, and casing differences that splinter one real category into several fake ones, plus the duplicate rows that double-count. These are the silent corrupters of any grouped or joined result.
The fourth is outliers and impossible values - the age of 999, the negative price, the date in 1900. The discipline here is to investigate before you erase, because an extreme value is sometimes an error and sometimes your most important record.
From hacks to a pipeline
Here is the shift that turns cleaning from a chore into a craft. Most people clean interactively: they poke at the data in a notebook, fix things by hand, and end up with a clean table they could never reproduce. The source data refreshes next month, and they start over from memory.
The better way is to treat cleaning as code. Write each fix as a small, named function that takes a table and returns a table. Chain them together into a single clean step. Now you have not produced one clean dataset; you have produced a machine that turns raw into clean, every time, identically. You can test each piece, reorder it, read it like a recipe, and hand it to a colleague. When the data updates, you press play.
That reproducibility is the whole game. It is the difference between an analysis you can defend and one you merely hope was right.
Respect the foundation
None of this is glamorous. There is no clever model at the end of a strip-whitespace command, no dashboard born from a successful date parse. But the analyses people admire are only as trustworthy as the cleaning beneath them. The quiet work of profiling a column, catching a disguised null, and standardizing a category is not the part you rush through to reach the real work. It is the real work. Get it right, keep it reproducible, and everything you build on top finally has something solid to stand on.
Key takeaways 5
- Messy data produces confident but wrong answers.
- Tidy data means one variable per column and one observation per row.
- Common messes: missing values, wrong types, duplicates and inconsistent labels.
- Turn cleaning steps into a repeatable, documented pipeline.
- Cleaning is the foundation of analysis, not a chore before it.
Watch & learn

Frequently asked questions
What is data wrangling?
Data wrangling, or data cleaning, is the process of transforming raw, messy data into a consistent, structured form that can be analyzed, including fixing types, handling missing values and reshaping tables.
What is tidy data?
Tidy data is a standard layout where each variable is a column, each observation is a row and each type of observational unit is a table, which makes analysis and plotting much easier.
How do I handle missing values in pandas?
Find them with isna(), then decide case by case: drop rows with dropna(), fill values with fillna() or flag them, depending on why the data is missing.
Go deeper with the free masterclass
Workshop, PDF handbook and curated resources for “Data Cleaning & Wrangling with pandas”.
Related articles

Data Analysis: From Spreadsheets to Python
You already think in rows, columns, and pivot tables. Here is why those same instincts make pandas the natural next step, and when it is worth the switch.
Practical Big Data Analytics
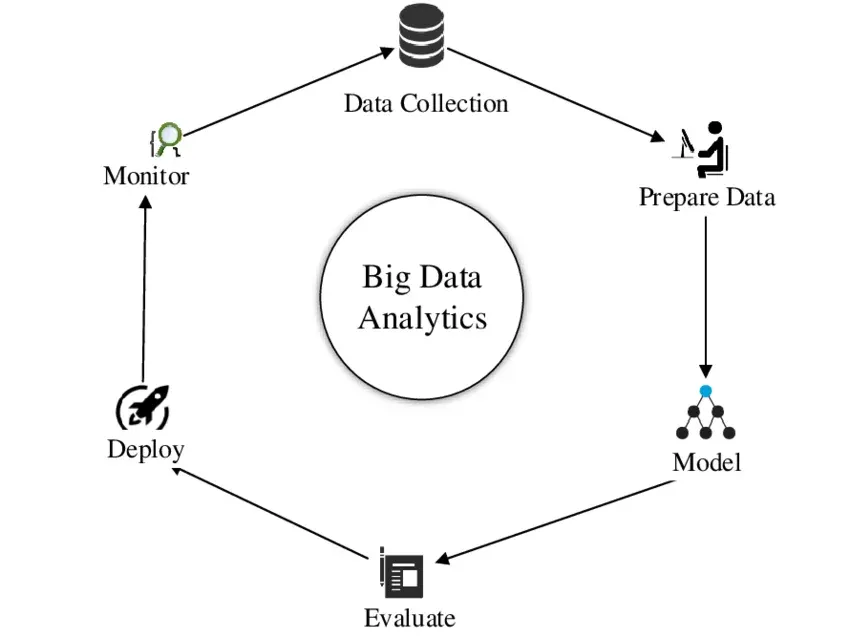
Everyone wants to say they work with big data. The freeing truth is that almost nobody does - and that means your laptop is more powerful than you think.
Building CLI Tools
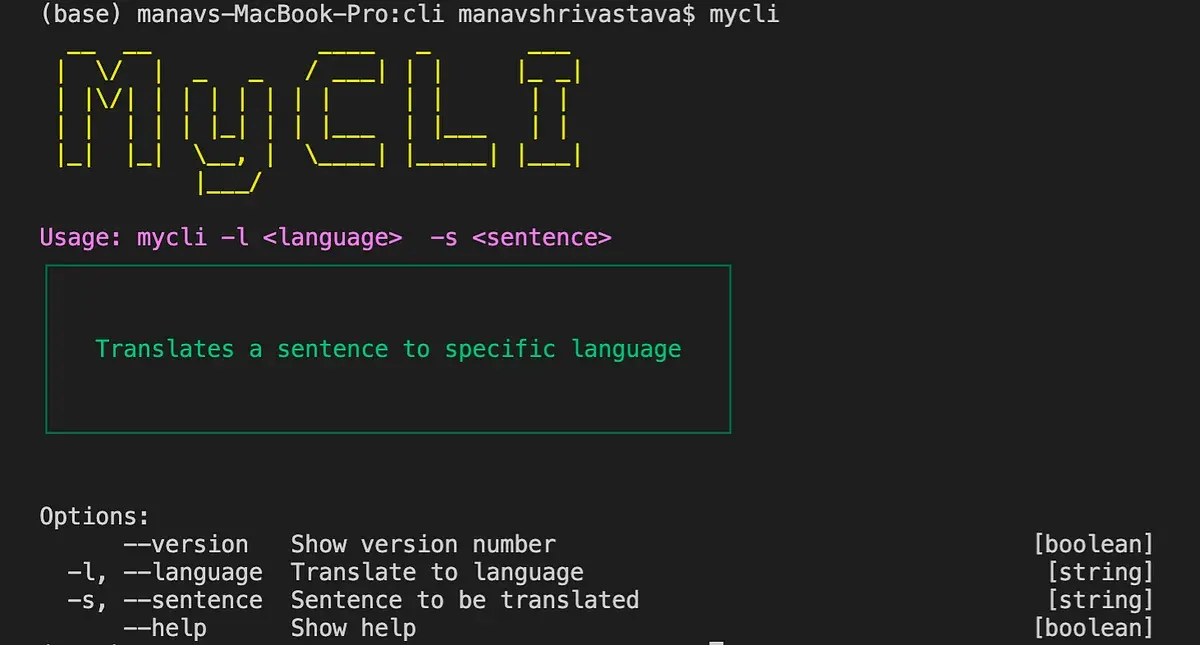
A command-line tool is a product with users. Treat it like one and it will outlive everything you build around it.
Comments
No comments yet. Start the conversation.